Market research shows that cost management in the public cloud is still at the top of the list of priorities for organisations looking to either move to the public cloud, or make better use of their existing public cloud investment.
Our Cloud Management Platform includes tools to help you govern the costs of your Microsoft Azure environment by grouping Azure resources together into cost centres, environments, or workloads to show the cost of those items in a business context. This helps not only understand the cost of business resources today, but also to plan for tomorrow.
Cost efficiency and understanding the breakdown of your costs between active resources, and those which are idle or even unallocated are important as well. This shifts the focus away from just cutting costs, to making sure costs are efficiently used.
Budgets can be assigned to easily track spend and understand projections, with notifications to Microsoft Teams when budgets enter warning or breached states. Granular cost insights enable you to look at daily costs and understand fundamental questions about your cloud spend such as identifying resources responsible for increases or decreases in costs.
Let’s now look at some of these features in more detail.
Manage your organisation structure
So, you can represent your costs in a context the business understands, you can define your Cost Centres, Environments, and Workloads within the portal. This allows you to allocate costs across your whole tenant regardless of how many subscriptions you have.

When creating Workloads, you can also state which Environments you have configured are part of that Workload, to help understand your costs for that Workload over different Environments.
The structure defined here flows throughout the Cost Management experience as well as into other features in the portal. This means that every view is in context of your business, rather than trying to interpret data on spreadsheets and technical resource names.
Setting and managing budgets
Budgets are an important mechanism in the management of your cloud costs. We’ve built the ability to define budgets for any of the organisation structure you have defined.

Budgets are recommended based on historical and projected usage for your selected structure, you can also set a notification channel in Microsoft Teams to have budget notifications sent to your Teams channel, rather than come through as another email in your Inbox. You can also define a warning threshold to determine when to send warning notifications.

Notifications are based upon a combination of projected and actual usage, so when you are projected to breach your budget, you are notified before this becomes a problem. This means you have time to look at your resources, and make any adjustments to stay under your budget, or re-evaluate the budget if required.

Understanding cost breakdown and efficiency
Optimising and managing your costs is a key activity of cloud management. A key part of optimising is understanding the breakdown of the costs you are incurring and how efficient those costs are overall.

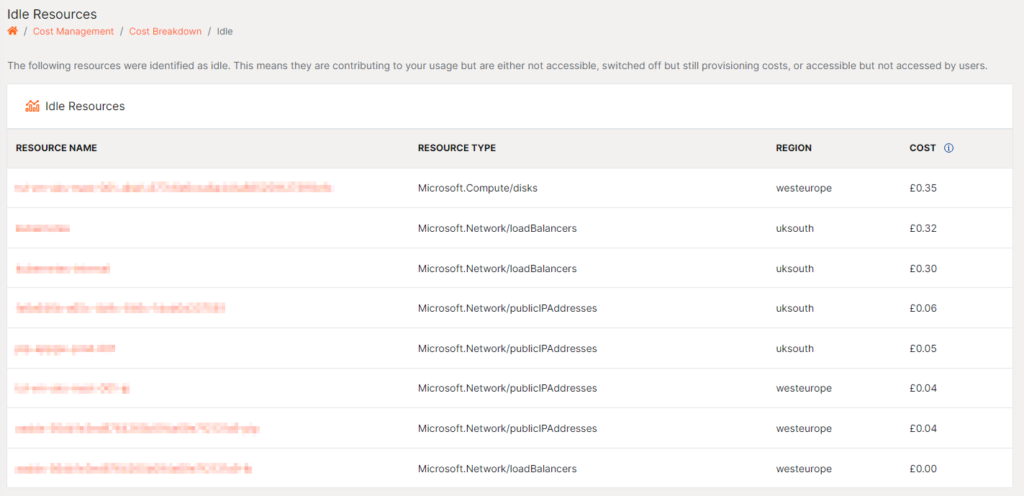
The Cost Management dashboard shows you a breakdown of costs which are utilised, idle, or unallocated. You can then interrogate the idle or unallocated costs to look for resources which can either be removed if no longer required, or scaled back to incur less cost.

All of that data goes to produce a Cost Efficiency index, the score out of 100 is designed to give you a visual indicator on how efficiently your costs are. The higher the score, the better, and the less percentage of your resources are either idle or unallocated.
Tracking context level costs
Through Cost Management, you also have the ability to track usage, forecasts, budgets, and performance against budget, as well as usage increases, and decreases to identify any resources which have a significant impact on your costs.

This view also shows you when your costs, either to date or forecasted will breach your budget, providing predictability for your consumption costs.
Identifying cost increases
We appreciate that looking at the consumption data may not be something you do each day, so to enable you to go back and look at usage increases and decreases historically, simply click one of the Daily Costs bars on the chart to view the biggest increases and decreases from the day before.
This gives you complete control over your cloud cost management, which means no nasty shocks in your monthly bill, and the ability to investigate and remediate impactful cost changes in your environment.
Together all these features give you the tools you need to organise, track and analyse spend while also identifying spend anomalies in real-time so that you can govern today while planning for the future.


